
Ljubljana will host the Symbolic Data Analysis (SDA) workshop, which will take place at the Faculty of Economics (FELU), from 12 to 14 June. This will be the sixth edition of this workshop which is to my knowledge the main regular event in this young and emerging field. Consequently, the workshop will host the actual main names in the field: the "founder" of the field Edwin Diday, Lynne Billard, Paula Brito, Masahiro Mizuta, and many others.
The field of symbolic data analysis is probably best described by a short quote from the article of Billard and Diday: "Increasingly, datasets are so large they must be summarized in some fashion so that the resulting summary dataset is of a more manageable size, while still retaining as much knowledge inherent to the entire dataset as possible. One consequence of this situation is that the data may no longer be formatted as single values such as is the case for classical data, but rather may be represented by lists, intervals, distributions, and the like. These summarized data are examples of symbolic data." (Billard and Diday, 2003: 470, klik)
Shortly said, symbolic data could be described as "summarized", i.e. aggregated data, capturing the information, contained in larger datasets. By this, a completely new conceptual world opens up. A dataset may from its outset be structured as a symbolic dataset, or, alternatively, it may be structured as a classical dataset, but when aggregated to establish it in a more manageable fashion, it becomes symbolic data. The variable which could form such analysis could be classified into three types: interval valued symbolic variables, (e.g. age could be recorded as being in an interval, for example, [0; 10); [10; 20); [20; 30), … – this could occur when the data point represents the age of a family or group of individuals whose collective ages fall in an interval (such as [20; 30) years, say), or the data may correspond to a single individual whose precise age is unknown but is known to be within an interval range); multivalued variables (e.g. suppose the variable represents type of automobile owned by a household, with domain {Chevrolet, Ford, Toyota, Volvo, …}); or modal variables (multistate variables with a frequency, probability, or weight attached to each specific value in the data).
As one could assume, working with symbolic data demands special types of methods and analysis – even descriptive statistics cannot be calculated in a "classical" manner. Basic descriptive statistics include frequency histograms and sample means and variances. Symbolic data analogs of these statistics differ by type of variable (for multivalued and interval-valued variables with rules and modal variables) and are presented in Billard and Diday. Many of the principles developed for the univariate case can be expanded to a general p-variate case, p > 1 which, in particular, permits a derivation of dependence measures.
As stated by Billard and Diday, unlike classical data, for which a century of effort has produced a considerable library of analytical/statistical methodologies, symbolic statistical analyses are new, and available methodologies are still only few in number (ibid.: 474). Some methods that have been developed have to be mentioned.
Firstly, there are extensions of multivariate analysis methods like principal components and factor analysis. Cazes, Chouakria, Diday, and Schektman (1997), Chouakria (1998), and Chouakria et al. (1999) have developed a method of conducting principal components analysis on symbolic data for interval valued variables. Factor analysis for interval data has been developed by Cheira, Brito and Duarte Silva (2015). PCA for three-way data has been explored by Ichino (2015).
Secondly, a lot of attention has been provided to the clustering of symbolic data, including important work done here by the Slovenian researchers. Many types of distances and methods (divisive and agglomerative) have been tried. The work with divisive methods mainly refers to Chavent (1998) for criterion-based divisive clustering. Monothetic divisive methods are not dissimilar from discriminant analysis methods, such as the CART algorithm of Brieman, Friedman, Olshen, and Stone (1984) or the ID3 algorithm of Quinlan (1986). Monothetic divisive clustering for conceptual objects was first introduced by Michalski, Diday, and Stepp (1981) and Michalski and Stepp (1983). In terms of agglomerative methods, building on Diday’s (1986) development of pyramid clusters for classical data, Brito (1994, 1995, 2000) gave an algorithm for developing pyramid clusters for symbolic data. Brito and DeCarvalho (1999) extended this to the case in which specific hierarchical rules exist, and DeCarvalho, Verde, and Lechevallier (1999) extended this to dependency rules. Polaillon (2000) developed pyramidal clusters for interval data using Galois lattice reductions. DeCarvalho et al. (1999) examined dynamic clustering of Boolean symbolic objects based on a content dependent proximity measure. Finally, Bock and Diday (2000) provided a comprehensive coverage of these approaches along with elucidating examples.
Third large stream are surely regression methods. Here, the discussion is very much undeveloped and some topics, like panel data estimators have even not been explored so far at all (at least based on the found literature). Therefore, mainly the methods for linear regression have been studied so far. In an excellent overview, Dias and Brito (2015) list the following studied approaches for interval valued variables: methods, based on symbolic covariance definitions (Billard and Diday, 2000; 2006; Xu, 2010); minimax method (Billard and Diday, 2002); center and range method (Lima Neto and De Carvalho, 2008); center and range least absolute deviation regression method (Maia and Carvalho, 2008); constrained center and range method (Lima Neto and De Carvalho, 2010); LASSO IR method (Giordani, 2014); bivariate symbolic regression models (Lima Neto et al, 2011); linear regression models for symbolic interval data using PSO algorithm (Yang et al, 2011); Monte Carlo method (Ahn et al, 2012); radial basis function networks (Su et al, 2012); copula interval regression method (Neto et al, 2012); and interval distributional model (Dias and Brito, 2015). Linear regression methods for histogram variables have been studied much fewer and Dias and Brito list the following main approaches: methods, based on symbolic covariance definitions (Billard and Diday, 2006); linear regression for numeric symbolic variables: OLS approach based on Wasserstein's/Mallow's distance (Verde and Irpino, 2015); and "common" linear regression model with histogram-valued variables (Dias and Brito, 2015).
Finally, several additional methods/approaches have been studied and applied. Firstly, there are applications of network analysis, including Bayesian approaches (e.g. Diday and Emilion, 2015). Large scale spatial networks have been studied in Drago and Reale (2015). Secondly, applications of compositional data approaches are becoming more frequent – one could say the two approaches share similarities (for some applications see e.g. Egozcue and Pawlowsky-Glahn, 2015; Pawlowsky-Glahn and Egozcue, 2015). Other methods from multivariate analysis, like linear discriminant analysis (for interval and histogram variables), have been used as well (see e.g. Dias, Amaral and Brito, 2015). Finally, additional approaches include machine learning (e.g. locally weighted non-parametric methods for interval data in Meco and Arroyo, 2015), generalized ANOVA (Batagelj et al., 2015), copula-based methods (Lima Neto, 2015), dynamic and fuzzy clustering (Irpino, Verde and De Carvalho, 2015), and other parametric and non-parametric approaches (see Diday, 2015).
The programing/computer part of working with symbolic data at present mainly includes two software solutions: specially developed software SODAS (klik) and several R libraries (for clustering, histogram variables, regression, etc.): MAINT.Data: Model and Analize Interval Data (Duarte Silva, Brito; CRAN 2011); clustDDist - Clustering Discrete Distributions; clamix - Clustering Symbolic Objects (Batagelj, Kejžar; R-Forge 2010); symbolicDA: Analysis of symbolic data (Dudek, Pelka; 2012); RSDA: An R package for symbolic data analysis (Murillo, Rodriguez, Villalobos; 2012); R2S: An R package to transform relational data into symbolic data (Murillo et al.).
For the end, let's shortly mention one nice application, co-authored by a Slovenian researcher (as mentioned above, Slovenian reseachers have done quite significant work in this field in the past 20 years (in particular the group around Prof. Vladimir Batagelj), among their most recent research two articles have to be noted: Korenjak-Černe et al. (2015) present clusters of the world's countries obtained by a novel weighted clustering method; and Batagelj et al. (2015a) propose a clustering criterion function for SOs such that the representative of each cluster is again composed of distributions of variables' values over the cluster; the corresponding leaders clustering method; and it is shown that for the corresponding agglomerative hierarchical method a generalized Ward's formula holds).
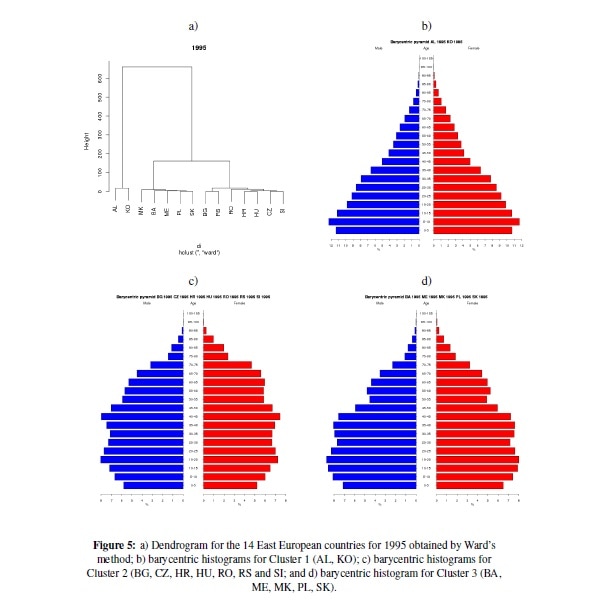
Katarina Košmelj and Lynne Billard have done a symbolic clustering analysis of population pyramids of the countries of Eastern Europe in years 1995-2015, based on Mallow's distance (Košmelj and Billard, 2011, klik). What is basically done in statistical terms, is cluster analysis based on a special type of cluster distance to group the countries on the basis of their age-sex distributions (i.e. population pyramid), which is of course an example of clustering for histogram variables.
The results reflect demographic changes in this short time-interval. In general, they observe a pattern of aging populations: a decline in the number of births and an increase in the number of elderly persons. For the majority of countries considered in the dataset, this has been going on long before 1990 and their pyramids reflect a constrictive shape within the observed period. For Kosovo, Albania and Macedonia, this process started after 1990. The results reflect that the countries are becoming more and more similar and follow a pattern of aging populations.
To our purpose it is illustrative to see the presentation of their main results. Below are the barycentric (centroid) histograms for 1995 for three clusters. The dendrogram below shows that the 14 countries are clustered into two clusters on the first level: Cluster 1 contains Albania (AL) and Kosovo (KO), while the remaining 12 countries are in the second cluster. The second cluster splits into two clusters; Cluster 2 has 5 countries: Bosnia and Herzegovina (BA), Macedonia (MK), Montenegro (ME), Poland (PL) and Slovakia (SK). In Cluster 3, there are the remaining 7 countries: Bolgaria (BG), Czech Republic (CZ), Croatia (HR), Hungary (HU), Romania (RO), Serbia (RS) and Slovenia (SI). The shape of the barycentric pyramid for Cluster 1 is expansive; for the other two clusters, it is constrictive.
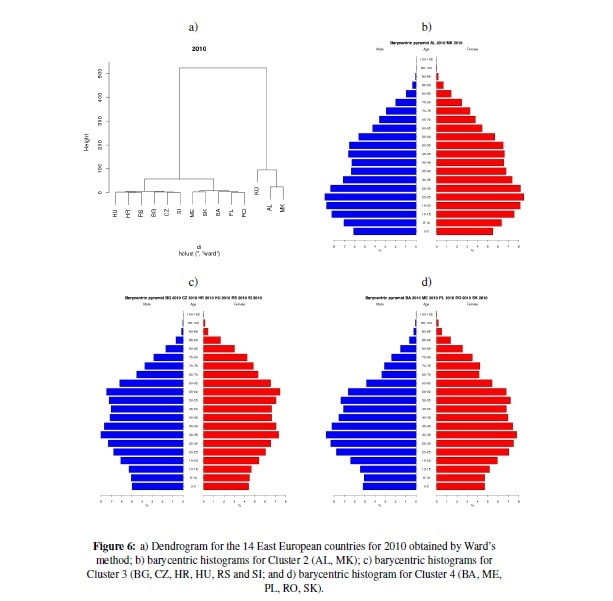
Finally, below is also the presentation of results for the final year 2015 (based on predicted data). The results suggest a significant change, observed already in 2010: MK moved to the cluster with AL and KO, suggesting two subclusters: one consisting of KO and the other of AL and MK. Therefore, the partition into 4 clusters was adopted. Cluster 1 consists of KO only, Cluster 2 of AL and MK, Cluster 3 of 6 countries: BG, CZ, HU, HR, RS and SI, and Cluster 4 of 5 countries: BA, ME, PL, RO and SK. The barycentric histograms for Cluster 2, 3 and 4 are presented in below, respectively.
To shortly conclude. The workshop (you will find more information here: klik) will be interesting to anyone interested in working with big data and trying new approaches that are developing here. It will feature most of the large names in the field, with several Slovenian "interventions". Surely, it is therefore worth visiting to anyone with interest in statistics, econometrics and mathematics – it will be highly interesting for sure.
Piše: Andrej Srakar.
P.S.: Kolikor bo čas dopuščal, sledi tudi slovenska verzija besedila.
Reference:
Ahn, J., Peng, M., Park, C., Jeon, Y. (2012). A resampling approach for interval-valued data regression. Stat. Anal. Data Min. 5, 336–348.
Batagelj, V., Kejžar, N., Korenjak-Černe, S. (2015a). Clustering of Modal Valued Symbolic Data. ArXiv e-prints, 1507.06683, July 2015.
Batagelj, V., Korenjak Černe, S., Kejžar, N. (2015b). Generalized ANOVA for SDA. Powerpoint presentation, 5th SDA Workshop, November 17-19, 2015, Orléans, France.
Billard, L., Diday, E. (2000). Regression analysis for interval-valued data. In: Proc. of IFCS’00, Belgium, pp. 369-374,Springer.
Billard, L., Diday, E. (2002). Symbolic Regression Analysis. In: Proc. IFCS’02, Poland, pp. 281-288, Springer.
Billard, L., Diday, E. (2003). From the Statistics of Data to the Statistics of Knowledge: Symbolic Data Analysis. JASA. Journal of the American Statistical Association. June, Vol. 98, N° 462.
Billard, L., Diday, E. (2006). Symbolic Data Analysis: Conceptual Statistics and Data Mining. Wiley.
Bock, H.-H., Diday, E. (eds.) (2000), Analysis of Symbolic Data: Exploratory Methods for Extracting Statistical Information From Complex Data, Berlin: Springer-Verlag.
Breiman, L., Friedman, J. H., Olshen, R. A., Stone, C. J. (1984), Classification and Regression Trees, Belmont, CA: Wadsworth.
Brito, P. (1994). Use of Pyramids in Symbolic Data Analysis. In New Approaches in Classification and Data Analysis, eds. E. Diday, Y. Lechevallier,M. Schader, P. Bertrand, and B. Burtschy, Berlin: Springer-Verlag, pp. 378–386.
Brito, P. (1995). Symbolic Objects: Order Structure and Pyramidal Clustering. Annals of Operations Research, 55, 277–297.
Brito, P. (2000). Hierarchical and Pyramidal Clustering With Complete Symbolic Objects. In Analysis of Symbolic Data: Exploratory Methods for Extracting Statistical Information From Complex Data, eds. H.-H. Bock and E. Diday, Berlin: Springer-Verlag, pp. 312–324
Brito, P., De Carvalho, F. A. T. (1999). Symbolic Clustering in the Presence of Hierarchical Rules. In Knowledge Extraction from Statistical Data, Luxembourg: European Commission Eurostat, pp. 119–128.
Cazes, P., Chouakria, A., Diday, E., Schektman, Y. (1997). Extensions de l’Analyse en Composantes Principales a des Donnees de Type Intervalle. Revue de Statistique Appliquee, 24, 5–24.
Chavent, M. (1998). A Monothetic Clustering Algorithm. Pattern Recognition Letters, 19, 989–996.
Chouakria, A. (1998). Extension des Methodes d’Analyse Factorielle a des Donees de Type Intervalle. Unpublished doctoral thesis, Université Paris Dauphine.
Chouakria, A., Diday, E., Cazes, P. (1999). An Improved Factorial Representation of Symbolic Objects. In Knowledge Extraction From Statistical Data, Luxembourg: European Commission Eurostat, pp. 301–305.
DeCarvalho, F. A. T., Verde, R., Lechevallier, Y. (1999). A Dynamical Clustering of Symbolic Objects Based on a Content Dependent Proximity Measure. Applied Statistical Models and Data Analysis, 15, 237–242.
Dias, S., Amaral, P., Brito, P. (2015). Linear Discriminant Analysis for Interval and Histogram Data. Powerpoint presentation, 5th SDA Workshop, November 17-19, 2015, Orléans, France.
Dias, S., Brito, P. (2015). Regression for Symbolic Data. Powerpoint presentation. Symbolic Data Analysis: Taking Variability in Data into Account, ECI 2015 - Buenos Aires.
Diday, E. (1986). Orders and Overlapping Clusters by Pyramids. In Multidimensional Data Analysis, eds. J. De Leeuw, W. J. Heisen, J. J. Meulman, and F. Critchley, Leiden, Netherlands: DSWO Press, pp. 201–234.
Diday, E. (2015). Explanatory Power of a Symbolic Data Table. Powerpoint presentation, 5th SDA Workshop, November 17-19, 2015, Orléans, France.
Diday, E., Emilion, R. (2015). Symbolic Bayesian Networks. Powerpoint presentation, 5th SDA Workshop, November 17-19, 2015, Orléans, France.
Drago, C., Reale, A. (2015). Symbolic Data Analysis of Large Scale Spatial Network Data. Powerpoint presentation, 5th SDA Workshop, November 17-19, 2015, Orléans, France.
Egozcue, J. J., Pawlowsky-Glahn, V. (2015). Compositional Analysis of Contingency Tables. Powerpoint presentation, 5th SDA Workshop, November 17-19, 2015, Orléans, France.
Giordani, P. (2014). Linear regression analysis for interval-valued data based on the Lasso technique. Adv. Data Anal. Classif. (2014) ISSN: 1862-5347.
Irpino, A., Verde, R. (2015). Linear regression for numeric symbolic variables: an ordinary least squares approach based on Wasserstein Distance. Adv Data Anal Classif 9(1), pp. 81-106.
Irpino, A., Verde, R., De Carvalho, F.A.T. (2015). Fuzzy clustering of distribution-valued data using an adaptive L2 Wasserstein distance. Powerpoint presentation, 5th SDA Workshop, November 17-19, 2015, Orléans, France.
Korenjak-Černe, S., Kejžar, N., Batagelj, V. (2015). A weighted clustering of population pyramids for the world's countries, 1996, 2001, 2006. Population studies, 69(1):105-120, 2015.
Košmelj, K., Billard, L. (2011). Clustering of population pyramids using Mallows’ L2 distance. Metodološki zvezki, 8, 1-15.
Lima Neto, E.d.A. (2015). Advances in regression models for interval variables: a copula based model. Powerpoint presentation, 5th SDA Workshop, November 17-19, 2015, Orléans, France.
Lima Neto, E.d.A., De Carvalho, F.A.T. (2008). Center and Range method for fitting a linear regression model to symbolic interval data. Computational Statistics & Data Analysis 52 (3), 1500-1515.
Lima Neto, E.d.A., De Carvalho, F.A.T. (2010). Constrained linear regression models for symbolic interval-valued variables. Computational Statistics & Data Analysis 54 (2), 333-347.
Lima Neto, E.d.A., Cordeiro, G.M., De Carvalho, F.A.T. (2011). Bivariate symbolic regression models for interval-valued variables. Journal of Statistical Computation and Simulation 81 (11), 1727-1744.
Maia, A., Carvalho, F. D. (2008). Fitting a least absolute deviation regression model on symbolic interval data. In Lecture Notes in Artificial Intelligence: Proceedings of the Ninth Brazilian Symposium on Artificial Intelligence, pp. 207–216. Springer-Verlag, Berlin.
Meco, A., Arroyo, J. (2015). Locally weighted learning methods for histogram data. Powerpoint presentation, 5th SDA Workshop, November 17-19, 2015, Orléans, France.
Michalski, R. S., Diday, E., Stepp, R. E. (1981). A Recent Advance in Data Analysis: Clustering Objects Into Classes Characterized by Conjunctive Concepts. In Progress in Pattern Recognition, eds. L. Kanal and A. Rosenfeld, Amsterdam: North-Holland, pp. 33–56.
Michalski, R. S., Stepp, R. E. (1984). Learning from Observation: Conceptual Clustering. In Machine Learning, eds. R. S. Michalski, J. G. Carbonell, and T. M. Mitchell, Berlin: Springer-Verlag, pp. 331–363.
Pawlowsky-Glahn, V., Egozcue, J. J. (2015). Sample space approach to compositional data. Powerpoint presentation, 5th SDA Workshop, November 17-19, 2015, Orléans, France.
Polaillon, G. (2000). Pyramidal Classification for Internal Data Using Galois Lattice Reduction. In Analysis of Symbolic Data: Exploratory Methods for Extracting Statistical Information From Complex Data, eds. H.-H. Bock and E. Diday, Berlin: Springer-Verlag, pp. 324–340.
Quinlan, J. R. (1986). Introduction of Decision Trees. Machine Learning, 1, 81–106.
Su, S. F., Chuang, C. C., Tao, C. W., Jeng, J. T., Hsiao, C. C. (2012). Radial basis function networks with linear interval regression weights for symbolic interval data. IEEE Trans. Syst., Man, Cybern., Part B Cybern., vol. 42, no. 1, pp. 69-80, Feb. 2012.
Xu, W. (2010). Symbolic Data Analysis: Interval-Valued Data Regression. PhD thesis, University of Georgia.
Yang, C., Chuang, C., Jeng, J., Tao, C. (2011). Constructing the linear regression models for the symbolic interval-values data using PSO algorithm. In Proc. International Conference on System Science and Engineering (ICSSE), Macau, China. 2011.
 RSS Feed
